Unveiling the Mysteries of Mxene: Exploring 5 Advanced Characterization Methods (XRD, Raman, XPS, UV-Vis, and FT-IR) for Enhanced Material Understanding
Only 10 $ per sample for interpreting of your FT-IR, Raman, XRD, UV-Vis, and XPS spectrum
Payment Upon Completion
Send your spectra…
What is Mxene?
Mxene is a class of two-dimensional (2D) transition metal carbides, nitrides, and carbonitrides that exhibit unique properties such as high electrical conductivity, excellent mechanical strength, and high surface areas. Mxenes were first discovered in 2011 by researchers at Drexel University and have since gained significant attention in the scientific community due to their potential applications in various fields such as energy storage, catalysis, and sensing.

There are several different types of mxenes that have been synthesized, with the most common being titanium carbide (Ti3C2), which is typically prepared by selectively etching aluminum atoms from layered ternary carbides known as MAX phases. Other types of mxenes include vanadium carbide (V2C), niobium carbide (Nb2C), and tantalum carbide (Ta4C3), among others.
The preparation of mxenes typically involves the following steps:
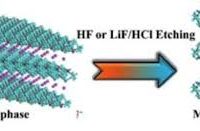
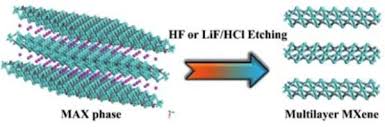
1. Synthesis of MAX phase: The first step in preparing mxenes is to synthesize the parent MAX phase material, which is a layered ternary compound consisting of a transition metal (M), a group A element (A), and carbon or nitrogen (X). Common MAX phases include Ti3AlC2, V2AlC, and Nb4AlC3.
2. Selective etching: The next step involves selectively etching the A element (usually aluminum) from the MAX phase using strong acids or other etchants. This process leaves behind a layered structure of transition metal carbides, nitrides, or carbonitrides, which are the mxene precursors.
3. Intercalation: In some cases, additional intercalation steps may be performed to introduce other elements or molecules between the layers of mxene to modify its properties.
4. Delamination: The final step in preparing mxenes involves delaminating the layered structure to obtain single or few-layered sheets of mxene. This can be achieved through mechanical exfoliation, sonication, or other methods.
Once prepared, mxenes can be further functionalized or integrated into various devices and applications. Their unique combination of properties makes them promising candidates for use in energy storage devices such as batteries and supercapacitors, as well as in catalysis, electromagnetic shielding, and water purification.
Therefore, mxenes represent a new class of 2D materials with exciting potential for a wide range of applications. Continued research into their synthesis, properties, and applications will likely uncover even more possibilities for these versatile materials in the future.
Raman spectroscopy for characterization of Mxene
Raman spectroscopy is a powerful technique used to characterize the structural and chemical properties of materials, including Mxenes. Mxenes, a class of two-dimensional transition metal carbides, nitrides, and carbonitrides, have gained significant attention in the scientific community due to their unique properties and potential applications in various fields. In this article, we will explore how Raman spectroscopy can be utilized to study and analyze Mxene materials.
Raman spectroscopy is a non-destructive analytical technique that provides information about the vibrational modes of a material. When a material is irradiated with monochromatic light, some of the incident photons are scattered at different energies due to interactions with the material’s molecular vibrations. These energy shifts, known as Raman shifts, provide valuable insights into the material’s chemical composition, crystal structure, and bonding characteristics.
For Mxenes, Raman spectroscopy offers several advantages in characterizing their properties. One key advantage is the ability to identify the presence of different functional groups and chemical bonds within the Mxene structure. The Raman spectrum of Mxenes typically exhibits characteristic peaks corresponding to the stretching and bending vibrations of metal-carbon or metal-nitrogen bonds, as well as other functional groups present in the material.
Additionally, Raman spectroscopy can be used to determine the crystallinity and layer thickness of Mxene samples. The intensity and position of Raman peaks can provide information about the stacking order and interlayer interactions within the Mxene structure. By analyzing the Raman spectra of Mxenes obtained from different synthesis methods or processing conditions, researchers can gain valuable insights into the structural properties of these materials.
Furthermore, Raman spectroscopy can be employed to study the electronic properties of Mxenes. By analyzing the Raman spectra at different excitation wavelengths or under different environmental conditions, researchers can probe the charge carrier dynamics, doping effects, and electronic band structure of Mxene materials. This information is crucial for understanding the electrical conductivity and optoelectronic properties of Mxenes, which are important for their applications in energy storage and electronic devices.
In conclusion, Raman spectroscopy is a versatile tool for characterizing Mxene materials and gaining insights into their structural, chemical, and electronic properties. By utilizing Raman spectroscopy in conjunction with other analytical techniques, researchers can further elucidate the fundamental properties of Mxenes and optimize their performance for various applications. Continued research in this area will undoubtedly contribute to unlocking the full potential of Mxene materials in the field of materials science and beyond.
XRD technique for characterization of Mxene
X-ray diffraction (XRD) is a powerful analytical technique widely used for the characterization of materials, including Mxenes. Mxenes, a class of two-dimensional transition metal carbides, nitrides, and carbonitrides, have garnered significant interest in the scientific community due to their unique properties and potential applications in various fields. In this article, we will explore how XRD can be utilized to study and analyze the structural properties of Mxene materials.
X-ray diffraction is based on the principle of Bragg’s law, which states that when X-rays are incident on a crystalline material, they will be diffracted at specific angles depending on the crystal structure and interatomic spacing of the material. By measuring the intensity and angle of the diffracted X-rays, researchers can obtain valuable information about the crystal structure, phase composition, crystallite size, and lattice parameters of a material.
For Mxenes, X-ray diffraction is a valuable tool for determining their crystal structure and phase composition. The XRD pattern of Mxene materials typically exhibits sharp diffraction peaks corresponding to the ordered atomic arrangement within the crystal lattice. By analyzing the positions and intensities of these peaks, researchers can identify the crystallographic phases present in the Mxene sample and determine the crystal symmetry and unit cell parameters.
Moreover, XRD can be used to study the layer stacking and interlayer spacing of Mxene materials. The interlayer distance between adjacent Mxene layers can be calculated from the position of the diffraction peaks in the XRD pattern. By analyzing the changes in interlayer spacing under different synthesis conditions or processing methods, researchers can gain insights into the structural properties and stability of Mxenes.
Additionally, X-ray diffraction can provide information about the crystallite size and degree of crystallinity of Mxene samples. The broadening of XRD peaks is often used to estimate the average crystallite size of the material, with smaller peak widths indicating smaller crystallite sizes. By quantifying the crystallite size distribution in Mxene samples, researchers can assess the degree of structural ordering and defects present in the material.
Furthermore, X-ray diffraction can be employed to investigate the thermal stability and phase transformations of Mxene materials. By performing in situ XRD measurements at different temperatures or under controlled atmospheres, researchers can monitor changes in the crystal structure and phase composition of Mxenes as a function of temperature or environmental conditions. This information is crucial for understanding the thermal behavior and performance of Mxene materials in high-temperature applications.
In conclusion, X-ray diffraction is a versatile technique for characterizing the structural properties of Mxene materials and gaining insights into their crystallographic features, interlayer spacing, crystallite size, and phase composition. By combining XRD with other analytical techniques, researchers can further elucidate the fundamental properties of Mxenes and optimize their performance for various applications. Continued research in this area will undoubtedly contribute to advancing our understanding of Mxene materials and harnessing their full potential in materials science and technology.
FT-IR spectroscopy for characterization of Mxene
Fourier-transform infrared spectroscopy (FT-IR) is a powerful analytical technique that is widely used for the characterization of materials, including Mxenes. Mxenes, a class of two-dimensional transition metal carbides, nitrides, and carbonitrides, have garnered significant interest in the scientific community due to their unique properties and potential applications in various fields. In this article, we will explore how FT-IR can be utilized to study and analyze the structural and chemical properties of Mxene materials.
FT-IR spectroscopy is based on the principle that molecules absorb infrared radiation at specific frequencies that are characteristic of their chemical bonds and functional groups. When infrared light is passed through a sample, certain wavelengths are absorbed by the sample, resulting in the excitation of molecular vibrations. By measuring the intensity of the absorbed infrared radiation as a function of wavelength, researchers can obtain valuable information about the chemical composition, bonding environment, and structural properties of a material.
For Mxenes, FT-IR spectroscopy is a valuable tool for identifying the functional groups present in the material and probing the bonding interactions between the transition metal atoms, carbon or nitrogen atoms, and other constituents. The FT-IR spectrum of Mxene materials typically exhibits characteristic absorption bands corresponding to the vibrational modes of different chemical groups, such as C-C, C-H, C=O, and M-X bonds (where M represents the transition metal and X represents carbon or nitrogen).
By analyzing the positions and intensities of these absorption bands in the FT-IR spectrum, researchers can identify the functional groups present in the Mxene sample and gain insights into the chemical structure and composition of the material. For example, the presence of specific absorption bands can indicate the presence of carbide or nitride groups in the Mxene structure, while shifts in peak positions can provide information about the coordination environment of the transition metal atoms.
Moreover, FT-IR spectroscopy can be used to study the surface chemistry and functionalization of Mxene materials. By analyzing changes in the FT-IR spectrum before and after surface modification or functionalization reactions, researchers can monitor the introduction of new chemical groups or functional moieties onto the Mxene surface. This information is crucial for tailoring the surface properties and reactivity of Mxenes for specific applications, such as catalysis, sensing, or energy storage.
Additionally, FT-IR spectroscopy can provide insights into the thermal stability and decomposition behavior of Mxene materials. By performing in situ FT-IR measurements at different temperatures or under controlled atmospheres, researchers can monitor changes in the infrared absorption bands associated with thermal degradation processes. This information is essential for understanding the thermal behavior and stability of Mxene materials under different environmental conditions.
In conclusion, Fourier-transform infrared spectroscopy is a versatile technique for characterizing the structural and chemical properties of Mxene materials and gaining insights into their functional groups, bonding interactions, surface chemistry, and thermal behavior. By combining FT-IR with other analytical techniques, researchers can further elucidate the fundamental properties of Mxenes and optimize their performance for various applications. Continued research in this area will undoubtedly contribute to advancing our understanding of Mxene materials and unlocking their full potential in materials science and technology.
XPS for characterization of Mxene
X-ray photoelectron spectroscopy (XPS) is a powerful analytical technique that is widely used for the characterization of materials, including Mxenes. Mxenes, a class of two-dimensional transition metal carbides, nitrides, and carbonitrides, have garnered significant interest in the scientific community due to their unique properties and potential applications in various fields. In this article, we will explore how XPS can be utilized to study and analyze the surface chemistry, elemental composition, and electronic structure of Mxene materials.
X-ray photoelectron spectroscopy is based on the principle that when a material is irradiated with X-rays, electrons from the inner shells of atoms are ejected, resulting in the emission of photoelectrons. By measuring the kinetic energy and intensity of these emitted electrons, researchers can obtain valuable information about the elemental composition, chemical bonding, oxidation states, and surface properties of a material.
For Mxenes, XPS spectroscopy is a valuable tool for probing the surface chemistry and elemental composition of the material. The XPS spectrum of Mxene materials typically exhibits characteristic peaks corresponding to the core levels of different elements present in the sample, such as transition metals (M), carbon (C), nitrogen (N), and oxygen (O). By analyzing the positions and intensities of these peaks, researchers can identify the elemental composition of the Mxene sample and gain insights into the bonding environment and oxidation states of the constituent elements.
Moreover, XPS can provide information about the electronic structure and valence band properties of Mxene materials. By analyzing the valence band spectrum obtained from XPS measurements, researchers can study the energy distribution of valence electrons in the material and investigate the electronic interactions between different atomic species. This information is crucial for understanding the electronic properties and charge transfer mechanisms in Mxene materials, which are important for their performance in various applications, such as energy storage, catalysis, and sensing.
Additionally, XPS spectroscopy can be used to study the surface functionalization and chemical modifications of Mxene materials. By performing XPS measurements before and after surface treatments or functionalization reactions, researchers can monitor changes in the elemental composition, chemical states, and surface functionalities of the Mxene sample. This information is essential for tailoring the surface properties and reactivity of Mxenes for specific applications and optimizing their performance in various technological applications.
Furthermore, XPS can provide insights into the stability and degradation behavior of Mxene materials under different environmental conditions. By performing in situ XPS measurements at elevated temperatures or under controlled atmospheres, researchers can monitor changes in the chemical states and oxidation states of the Mxene sample during thermal treatments or exposure to reactive gases. This information is crucial for understanding the thermal stability and reactivity of Mxene materials and optimizing their performance for high-temperature applications.
In conclusion, X-ray photoelectron spectroscopy is a versatile technique for characterizing the surface chemistry, elemental composition, electronic structure, and stability of Mxene materials. By combining XPS with other analytical techniques, researchers can gain comprehensive insights into the fundamental properties of Mxenes and tailor their surface properties for specific applications. Continued research in this area will undoubtedly contribute to advancing our understanding of Mxene materials and unlocking their full potential in materials science and technology.
UV-Vis spectroscopy for characterization of Mxene
Ultraviolet-visible (UV-Vis) spectroscopy is a powerful analytical technique that is commonly used for the characterization of materials, including Mxenes. Mxenes, a class of two-dimensional transition metal carbides, nitrides, and carbonitrides, have garnered significant interest in the scientific community due to their unique properties and potential applications in various fields. In this article, we will explore how UV-Vis spectroscopy can be utilized to study and analyze the optical properties, electronic transitions, and bandgap of Mxene materials.
UV-Vis spectroscopy is based on the principle that when a material is irradiated with ultraviolet or visible light, electrons in the material can be excited from the ground state to higher energy states. By measuring the absorption or transmission of light at different wavelengths, researchers can obtain valuable information about the electronic transitions, band structure, and optical properties of the material.
For Mxenes, UV-Vis spectroscopy is a valuable tool for probing the electronic structure and optical properties of the material. The UV-Vis spectrum of Mxene materials typically exhibits characteristic absorption peaks corresponding to electronic transitions between different energy levels in the material. These absorption peaks can provide insights into the bandgap energy, electronic band structure, and optical transitions in Mxene materials.
The bandgap energy of a material is a critical parameter that determines its electronic and optical properties. By analyzing the absorption spectrum obtained from UV-Vis measurements, researchers can estimate the bandgap energy of Mxene materials and gain insights into their electronic band structure. The bandgap energy of Mxenes can be influenced by various factors, such as the composition, structure, and surface functionalization of the material, making UV-Vis spectroscopy an essential tool for studying and optimizing the optical properties of Mxenes for specific applications.
Moreover, UV-Vis spectroscopy can provide information about the electronic transitions and excitonic effects in Mxene materials. Excitonic effects arise from the interaction between photo-excited electrons and holes in a material, leading to the formation of excitons with distinct optical properties. By analyzing the absorption spectrum and peak shapes in UV-Vis measurements, researchers can study the excitonic effects in Mxene materials and investigate their impact on the optical properties and charge carrier dynamics of the material.
Additionally, UV-Vis spectroscopy can be used to study the surface plasmon resonance (SPR) properties of Mxene materials. SPR is a phenomenon that occurs when free electrons in a material collectively oscillate in response to incident light, leading to enhanced light absorption and scattering at specific wavelengths. By performing UV-Vis measurements at different angles or polarizations, researchers can investigate the SPR properties of Mxene materials and tailor their optical properties for applications such as sensors, photodetectors, and plasmonic devices.
Furthermore, UV-Vis spectroscopy can be employed to study the stability and degradation behaviour of Mxene materials under different environmental conditions. By performing in situ UV-Vis measurements under controlled temperatures or atmospheres, researchers can monitor changes in the optical properties and electronic transitions of the material during thermal treatments or exposure to reactive gases. This information is crucial for understanding the stability and reactivity of Mxene materials and optimizing their performance for applications requiring high temperatures or harsh environments.
In conclusion, UV-Vis spectroscopy is a versatile technique for characterizing the optical properties, electronic transitions, and bandgap of Mxene materials. By combining UV-Vis spectroscopy with other analytical techniques, researchers can gain comprehensive insights into the fundamental properties of Mxenes and tailor their optical properties for specific applications. Continued research in this area will undoubtedly contribute to advancing our understanding of Mxene materials and unlocking their full potential in materials science and technology.