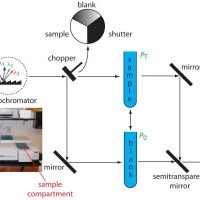
In Figure 10.9 we examined Nessler’s original method for matching the color of a sample to the color of a standard. Matching the colors was a labor intensive process for the analyst. Not surprisingly, spectroscopic methods of analysis were slow to develop. The 1930s and 1940s saw the introduction of photoelectric transducers for ultraviolet and visible radiation, and thermocouples for infrared radiation. As a result, modern instrumentation for absorption spectroscopy became routinely available in the 1940s—progress has been rapid ever since.
While interaction with infrared light causes molecules to undergo vibrational transitions, the shorter wavelength, higher energy radiation in the UV (200-400 nm) and visible (400-700 nm) range of the electromagnetic spectrum causes many organic molecules to undergo electronic transitions. What this means is that when the energy from UV or visible light is absorbed by a molecule, one of its electrons jumps from a lower energy to a higher energy molecular orbital.
Our XRD interpretation includes:
1. Phase determination
2. Determination of diffracted planes
3- Calculation of crystalline size and microstrain
4- Whatever your request
Its cost is only 12$
Payment Upon Completion

Send your patterns...
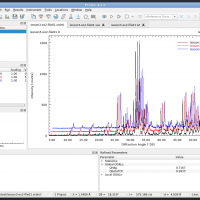
Profex
What is Profex?
Profex is a graphical user interface for Rietveld refinement of powder X-ray diffraction data with the program BGMN. It provides a large number of convenience features and facilitates the use of the BGMN Rietveld backend in many ways.
Only 10 $ for interpretation of each element in your XPS spectrum
Payment Upon Completion

Send your spectra...
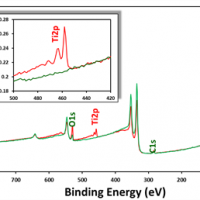
What is XPS?
XPS is a surface-sensitive technique based on the photoelectric effect, which occurs when atoms or molecules are irradiated by photons of suitable energy, resulting in the ejection of electrons. The kinetic energy of the ejected electrons depends upon the elemental core level from which they originated.
Using this information, XPS data can be used to determine the elemental composition of the surface and, in most cases, the bonding environment of the elements.
Only 10 $ for interpretation of each in element your XPS spectrum
Payment Upon Completion

Send your spectra...
Introduction
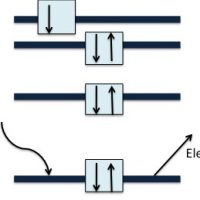
X-Ray photoelectron spectroscopy (XPS), also known as electron spectroscopy for chemical analysis (ESCA), is one of the most widely used surface techniques in materials science and chemistry. It allows the determination of atomic composition of the sample in a non-destructive manner, as well as other chemical information, such as binding constants, oxidation states and speciation. The sample under study is subjected to irradiation by a high energy X-ray source. The X-rays penetrate only 5 – 20 Å into the sample, allowing for surface specific, rather than bulk chemical, analysis. As an atom absorbs the X-rays, the energy of the X-ray will cause a K-shell electron to be ejected, as illustrated by Figure 1.13.11.13.1. The K-shell is the lowest energy shell of the atom. The ejected electron has a kinetic energy (KE) that is related to the energy of the incident beam (hν), the electron binding energy (BE), and the work function of the spectrometer (φ) (1.13.11.13.1). Thus, the binding energy of the electron can be calculated.
Figure 1.13.11.13.1 Excitation of an electron from an atom’s K-shell.(more…)
Only 10 $ for interpretation of each element in your XPS spectrum
Payment Upon Completion

Send your spectra...
Principle
X-ray Photoelectron Spectroscopy (XPS) or Electron Spectroscopy for Chemical Analysis (ESCA) is a technique which analyzes the elements constituting the sample surface, its composition, and chemical bonding state by irradiating x-rays on the sample surface, and measuring the kinetic energy of the photoelectrons emitted from the sample surface. XPS instrument using Al Kα rays can generally obtain information on elements within a few nms of the sample surface.
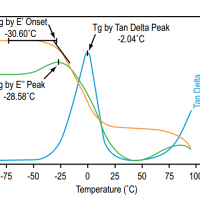
Only 12$ for interpretation of your DMA thermogram
Payment Upon Completion

 Send your thermograms...
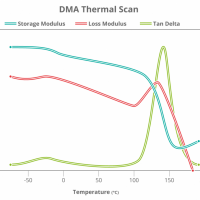
Dynamic Mechanical Analysis or DMA for short, is an extremely versatile and flexible analytical technique for measuring the physical properties (incl: storage modulus, glass transition temperature, etc..) of a range of materials. Although initial attempts to perform this type of testing started in the early 20th century, commercial machines were not available until the 1950s and these were extremely limited in what they could do. It was not until the 1980s, when the processing power of computers were combined with the mechanics of the DMA, that the technique acquired wider appeal among scientists. During this time many commercial instrument suppliers began to sell DMA machines and gave the technique various different names, some of which are still in use today such as as dynamic mechanical thermal analysis (DMTA), dynamic mechanical spectroscopy or dynamic thermomechanical analysis.
Only 12$ for interpretation of your DMA thermogram
Payment Upon Completion

 Send your thermograms...
Dynamic mechanical analysis (DMA), also known as forced oscillatory measurements and dynamic rheology, is a basic tool used to measure the viscoelastic properties of materials (particularly polymers). To do so, DMA instrument applies an oscillating force to a material and measures its response; from such experiments, the viscosity (the tendency to flow) and stiffness of the sample can be calculated.
Only 8$ for interpretation of your EDS spectrum
and 10$ for interpretation of your SEM/TEM micrograghsPayment Upon Completion
Send your results...
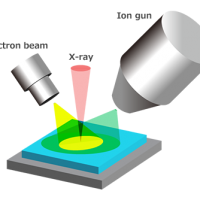
Interaction of an electron beam with a sample target produces a variety of emissions, including x-rays. An energy-dispersive (EDS) detector is used to separate the characteristic x-rays of different elements into an energy spectrum, and EDS system software is used to analyze the energy spectrum in order to determine the abundance of specific elements. EDS can be used to find the chemical composition of materials down to a spot size of a few microns, and to create element composition maps over a much broader raster area. Together, these capabilities provide fundamental compositional information for a wide variety of materials.
EDS systems are typically integrated into either an SEM or EPMA instrument. EDS systems include a sensitive x-ray detector, a liquid nitrogen dewar for cooling, and software to collect and analyze energy spectra. The detector is mounted in the sample chamber of the main instrument at the end of a long arm, which is itself cooled by liquid nitrogen. The most common detectors are made of Si(Li) crystals that operate at low voltages to improve sensitivity, but recent advances in detector technology make availabale so-called “silicon drift detectors” that operate at higher count rates without liquid nitrogen cooling.
An EDS detector contains a crystal that absorbs the energy of incoming x-rays by ionization, yielding free electrons in the crystal that become conductive and produce an electrical charge bias. The x-ray absorption thus converts the energy of individual x-rays into electrical voltages of proportional size; the electrical pulses correspond to the characteristic x-rays of the element.
Strengths
When used in “spot” mode, a user can acquire a full elemental spectrum in only a few seconds. Supporting software makes it possible to readily identify peaks, which makes EDS a great survey tool to quickly identify unknown phases prior to quantitative analysis.
EDS can be used in semi-quantitative mode to determine chemical composition by peak-height ratio relative to a standard.
Limitations
There are energy peak overlaps among different elements, particularly those corresponding to x-rays generated by emission from different energy-level shells (K, L and M) in different elements. For example, there are close overlaps of Mn-Kα and Cr-Kβ, or Ti-Kα and various L lines in Ba. Particularly at higher energies, individual peaks may correspond to several different elements; in this case, the user can apply deconvolution methods to try peak separation, or simply consider which elements make “most sense” given the known context of the sample.
Because the wavelength-dispersive (WDS) method is more precise and capable of detecting lower elemental abundances, EDS is less commonly used for actual chemical analysis although improvements in detector resolution make EDS a reliable and precise alternative.
EDS cannot detect the lightest elements, typically below the atomic number of Na for detectors equipped with a Be window. Polymer-based thin windows allow for detection of light elements, depending on the instrument and operating conditions.
Results
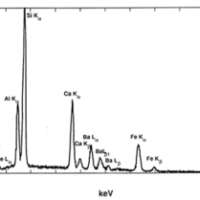
A typical EDS spectrum is portrayed as a plot of x-ray counts vs. energy (in keV). Energy peaks correspond to the various elements in the sample. Generally they are narrow and readily resolved, but many elements yield multiple peaks. For example, iron commonly shows strong Kα and Kβpeaks. Elements in low abundance will generate x-ray peaks that may not be resolvable from the background radiation.
EDS spectrum of multi-element glass (NIST K309) containing O, Al, Si, Ca, Ba and Fe (Goldstein et al., 2003). Details
EDS spectrum of biotite, containing detectable Mg, Al, Si, K, Ti and Fe (from Goodge, 2003). Details
References
Severin, Kenneth P., 2004, Energy Dispersive Spectrometry of Common Rock Forming Minerals. Kluwer Academic Publishers, 225 p.–Highly recommended reference book of representative EDS spectra of the rock-forming minerals, as well as practical tips for spectral acquisition and interpretation.
Goldstein, J. (2003) Scanning electron microscopy and x-ray microanalysis. Kluwer Adacemic/Plenum Pulbishers, 689 p.
Reimer, L. (1998) Scanning electron microscopy : physics of image formation and microanalysis. Springer, 527 p.
Egerton, R. F. (2005) Physical principles of electron microscopy : an introduction to TEM, SEM, and AEM. Springer, 202.
Clarke, A. R. (2002) Microscopy techniques for materials science. CRC Press (electronic resource)
[corner-ad id="1"]
Analysis and interpretation of thermogravimetric analysis (TGA) results
Only 10$ for interpretation of your TGA thermogram
Payment Upon Completion

 Send your thermograms...
TGA is a powerful and robust technique to explore the thermal stability of a material. By accurately monitoring the weight of a sample while heating at a constant rate, we can measure changes in a sample’s weight and attribute this to a specific material response to a thermal stress (Figure 1). This is perfect for exploring, in detail, decomposition temperatures and ensuring a material performs adequately in a given temperature range.