Click here to see more posts about NMR
Only 15$ per sample for interpreting of your NMR spectrum
Payment Upon Completion
Send your results...
Nuclear Magnetic Resonance (NMR) spectroscopy is an incredibly powerful tool for characterizing molecular structures. When submitting to the FDA or other regulatory agencies, full structural characterization by NMR provides crucial evidence of compound identity. A combination of 1-dimensional and 2-dimensional NMR experiments are necessary for complete confidence in chemical structure.
This post will walk you through the steps to fully characterize a molecule by 1- and 2-dimensional NMR, including on how to perform NMR interpretation.


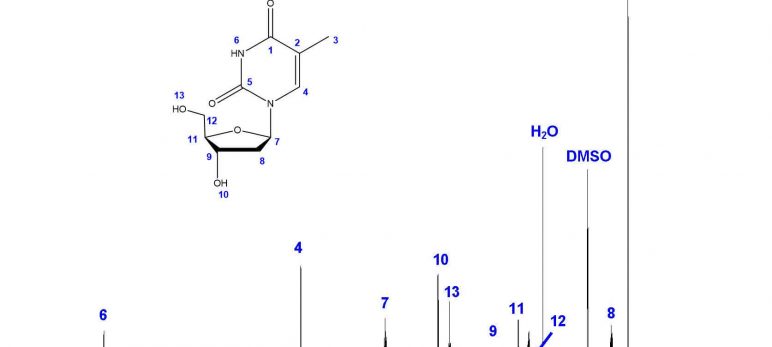
Step 1: ¹H-NMR
The first step in structural characterization is 1-dimensional proton ¹H-NMR. The chemical shift, multiplicity, coupling constants, and integration are all factors to consider when assigning protons. In this example, only three protons can be assigned by the proton spectrum alone: protons 3, 4, and 6.

| Chemical Shift (ppm) | Multiplicity | Coupling Constant (Hz) | Integration |
| 11.256 | s | – | 1H |
| 7.690 | q | 1.2 | 1H |
| 6.163 | t | 6.8 | 1H |
| 5.209 | d | 4.0 | 1H |
| 4.999 | t | 5.2 | 1H |
| 4.233 | m | – | 1H |
| 3.754 | q | 3.7 | 1H |
| 3.564 | m | – | 2H |
| 2.068 | m | – | 2H |
| 1.770 | d | 1.2 | 3H |
To begin, let’s start with proton 3. Proton 3 is the only methyl group in the structure, and therefore must integrate to 3 protons. The only peak with an integration of 3 is the doublet at 1.770 ppm. The high field chemical shift supports this assignment. The peak is split into a doublet with a coupling constant of 1.2 Hz, reflecting the long-range coupling between protons 3 and 4, which also supports this assignment.
Protons that are coupled to each other should exhibit the same coupling constant. The long-range coupling constant observed for proton 3 (J=1.2 Hz, split into a doublet by proton 4) is reflected in the coupling constant for proton 4 (J=1.2 Hz, split into a quartet by proton 3). Therefore, the peak at 7.690 ppm must represent proton 4! The integration and chemical shift support the assignment, as proton 4 is the only aromatic proton in the structure.
There is only one singlet in the ¹H-NMR spectrum. The only proton that should show up as a singlet is proton 6, as it has no neighboring protons that would split the peak (the nearest proton is 5 bonds away!). The chemical shift of 11.256 ppm supports this assignment, as imide protons often show up far downfield. The peak also integrates to 1 proton, supporting the assignment.
The remaining protons are doublets, triplets, and multiplets that can be assigned by 2-dimensional COSY.

Step 2: ¹H-¹H COSY
¹H-¹H Correlation Spectroscopy (COSY) shows the correlation between hydrogens which are coupled to each other in the ¹H NMR spectrum. The ¹H spectrum is plotted on both 2D axes. While 2-bond and 3-bond ¹H-¹H coupling is easily visible by COSY, long range coupling can also be observed with long acquisition times. The cross-peaks (not on the diagonal) that are symmetric to the diagonal show the COSY correlations. For example, protons 3 and 4 are coupled to each other, since they form a box pattern symmetric to the diagonal. This confirms assignments 3 and 4 made from the proton spectrum alone.

Two types of COSY coupling: 3-bond short range coupling between protons 7 and 8 (red) and 4-bond long range coupling between protons 3 and 4 (blue).

My favorite way to analyze a COSY spectrum with many unassigned protons is to make a table of correlations, like the one seen here. Look at the table for any clear differences in correlation and begin there! In this example, all unassigned protons show one or two COSY correlations-except the proton at 4.233 ppm, which correlates to threeother protons by COSY. The only proton expected to correlate with three nonequivalent protons is proton 9!
| Chemical Shift (ppm) | COSY correlations | Assignment |
| 11.256 | none | 6 |
| 7.690 | 4-3 | 4 |
| 6.163 | one | ? |
| 5.209 | one | ? |
| 4.999 | one | ? |
| 4.233 | three | ? |
| 3.754 | two | ? |
| 3.564 | two | ? |
| 2.068 | two | ? |
| 1.770 | 3-4 | 3 |
Now that proton 9 has been assigned, the fun really begins. Thymidine’s structure suggests that proton 9 should couple protons 8, 10, and 11. Based on the COSY, proton 9 couples protons at 2.068 ppm (2H), 3.754 ppm (1H), and 5.209 ppm (1H). From this list, we can easily assign proton 8 as the peak at 2.068 ppm based on its integration of 2 protons. To differentiate protons 10 and 11, take a look at our COSY table; 3.754 ppm shows two COSY correlations, while 5.209 ppm only shows one. Therefore, we can assign proton 10 as 5.209 ppm and proton 11 as 3.754 ppm.
Once proton 8 has been assigned, we can easily assign proton 7 based on the remaining COSY correlation for proton 8. Proton 7’s peak at 6.163 ppm is split into a triplet by the two 8 protons, confirming the assignment.
All that remains are protons 12 and 13. We can assign proton 12 (3.564 ppm) based on its integration of 2H and its COSY correlation to proton 11. The last remaining peak at 4.999 ppm must be proton 13; this is confirmed by COSY correlation with proton 12, triplet multiplicity based on splitting by proton 12, and integration of one proton.

Now we have a fully assigned ¹H-NMR spectrum! This spectrum will help us assign our carbons using HSQC and HMBC NMR spectroscopy.

Step 3: ¹³C-NMR
Carbon NMR is a necessary step in full structural characterization. However, ¹³C-NMR alone does not provide enough information to assign the carbons in the molecule. The NMR spectrum below does confirm the number of carbons in the molecule; however, HSQC and HMBC (we will get to these soon!) are necessary to assign the carbons with confidence. Note that one of the carbons is hidden beneath the solvent signal but is clearly visible after zooming into that region.

Step 4: DEPT-45, 90, and 135
Distortionless Enhancement of Polarization Transfer (DEPT) experiments help assign carbon peaks by determining the number of protons attached to each carbon. For very simple molecules, DEPT may be enough to partially or fully assign all carbons. In complex molecules, DEPT and HSQC together are useful for confirming both carbon and proton assignments. For example, the DEPT experiments below can only identify carbon 3-it is the only CH₃ peak. I always go back and use DEPT to confirm the carbons I assigned by HSQC.
- DEPT-45 shows CH, CH₂, and CH₃ carbons as positive peaks. Carbons with no protons are not visible.
- DEPT-90 shows only CH peaks as positive peaks. Carbons with no protons, CH₂, and CH₃ carbons are not visible.
- DEPT-135 shows CH and CH₃ carbons as positive peaks and CH₂ carbons as negative peaks. Carbons with no protons are not visible.

Step 5: ¹H-¹³C HSQC
¹H-¹³C Heteronuclear Single Quantum Coherence Spectroscopy (HSQC) shows which hydrogens are directly attached to which carbon atoms. The ¹H spectrum is shown on the horizontal axis and the ¹³C spectrum is shown on the vertical axis. The HSQC spectrum is most valuable when protons have already been assigned.
For example, HSQC shows a correlation between proton 4 and the carbon at 136.113 ppm; this carbon is now assigned as carbon 4. Carbons 3, 4, 7, 8, 9, 11, and 12 are assigned by HSQC. Only 1-bond correlations are observed, so HSQC assignments are relatively straightforward. The DEPT experiments also confirm these assignments. HSQC is also useful in confirming proton assignments of nitrogen or oxygen-bound protons; they show no signal by HSQC. This further supports the assignments of protons 6, 10, and 13.


An example correlation between proton and carbon 4 is observed by HSQC.
Step 6: ¹H-¹³C HMBC
¹H-¹³C Heteronuclear Multiple Bond Correlation Spectroscopy (HMBC) shows the correlations between protons and carbons that are separated by multiple bonds. The ¹H spectrum is shown on the horizontal axis and the ¹³C spectrum is shown on the vertical axis. Correlated atoms are shown in blue and the connecting atoms are shown in red. Note that direct hydrogen-carbon bonds (1-bond correlations) are generally not seen. For example, hydrogen 4 shows correlations with carbons 1, 2, 3, 5, and 7, but not carbon 4.

HMBC interactions between proton 4 and carbons 1, 2, 3, 5, and 7.
HMBC is incredibly useful for assigning carbons that have no protons attached. In this example, carbons 1, 2, and 5 have no protons attached. Carbon 1 is assigned by HMBC interactions with protons 3, 4, and 6; carbon 2 by interaction with protons 3, 4, 6, and 7; and carbon 5 by interactions with protons 4 and 7 only. The chemical environment of carbon 5 suggests it would appear more downfield than carbon 1, which confirms these assignments.
| HMBC | Proton | |||
| Carbon | 3 | 4 | 6 | 7 |
| 1 | x | x | x | |
| 2 | x | x | x | x |
| 5 | x | x |
HMBC also confirms assignments that were based solely on the proton and COSY spectrum. For example, protons 10 and 13 are differentiated by HMBC; proton 10 is confirmed by interactions with carbons 8, 9, and 11, while proton 13 is confirmed by interactions with 11 and 12. HMBC supports all proton and all carbon assignments, unambiguously confirming both the structure and analysis of thymidine.


At Emery Pharma, we are experts in 1D and 2D NMR characterization and structure elucidation; in fact, 2D NMR projects are some of our favorites! We have supported numerous pharmaceutical companies in full NMR characterization for API submissions to regulatory agencies, as well as complete structure elucidation of impurities. We provide a fully annotated report with images similar to those seen here and support our results with high resolution mass spectrometry and elemental analysis.
Some nuclei rotate around their axis like electrons. In the presence of an external magnetic field, a rotating nucleus has only a small number of stable orientations. Nuclear magnetic resonance (NMR) occurs when a spinning core is excited from a lower energy orientation to a higher energy orientation in the presence of a magnetic field by absorbing enough electromagnetic radiation. Nuclear magnetic resonance spectroscopy involves measuring the amount of energy required to change spin nuclei from a stable orientation to a more unstable orientation in a magnetic field. Because spin-core nuclei change direction in a magnetic field at different frequencies, different frequencies of absorbing radiation are needed to change the orientation of spin-core nuclei. The frequency at which the absorption takes place is used for analysis and spectroscopy [1].
Nuclear magnetic resonance was first discovered independently in 1946 by Felix Bloch of Stanford University and Edward Parcel of Harvard University. They were able to show the absorption of electromagnetic radiation as a result of the transfer of the energy level of the nucleus in a strong magnetic field. The two physicists won the Nobel Prize in 1952 for their work. In the first five years after the discovery of the nuclear magnetic resonance method, chemists discovered that the molecular environment of objects affects the absorption of radiation by nuclei in the presence of a magnetic field, and this effect could be related to the structure of the molecule. Since then, the growth of magnetic resonance spectroscopy has been explosive and this method has had a significant effect on the development of organic chemistry, inorganic chemistry and biochemistry [2]. In 1999, a team of Canadian physicists developed a new method using the Beta Nuclear Magnetic Resonance Method, which is capable of demonstrating the magnetic and electrical properties of very thin layers and surfaces. BetaNMR methods are used in nanoscience. Be [3].
The magnitude of the spin angle motion in the nuclei is determined by the quantum number of the nucleus spin. Quantum number The core spin of any number can be integer or semi-integer. In 16 O and 12C non-spin nuclei, the quantum spin number of the nucleus is zero. Cores that are not spin and therefore do not have the magnitude of the spin angle motion can not be detected by NMR spectroscopy. Spin-core cores with spherical charge distribution have a spin quantum number of 1/2. Examples of these nuclei include 13C, 19F, 3H, 15N, 31P and 1H, which have a quantum number of 1/2 and a magnetic moment. In order for a nucleus in a magnetic field to absorb a large amount of electromagnetic radiation, it must have a high frequency in the sample and also have a relatively large magnetic moment (µ). Cores that have both properties in question include 1H, 19F, 21P. Most NMR measurements are usually performed for 1 h. Measurements of other nuclei are often performed using signal amplification methods to observe the spectrum. Usually, among the nuclei with low relative frequency that show the magnetic resonance of the nucleus, 12 C, 15N, 16O are the most important for chemists. The magnetic resonance method of the hydrogen nucleus (1H), which is used more than other nuclei, has a magnetic torque of about 79.2 برای. It will be magnetic. For other cores used for nuclear magnetic resonance spectroscopy, the magnetic torque for 21P, 19F 12C is 6873.2, 1305.1 and 0.7022, respectively [4]. In most cases, the sensitivity of non-proton core magnetic resonance devices, such as 12C, etc., is lower than that of HNMR. Also, in most compounds, the natural abundance of non-proton magnetic nuclei is significantly lower than that of protons. This factor causes the NMR spectra of non-proton nuclei to have a relatively low noise signal. The peaks of these spectra are small, and often the spectrum cannot be determined if the same device used for proton nucleus (PMR) NMR is used. Due to the low signal-to-noise ratio in these cases, most devices designed to record the NMR spectra of non-proton nuclei use multiple traverses with signal averaging techniques. The most common devices for spectral peak extraction use the Fourier transform. Fourier transformers are also used to prepare PMR spectra of dilute solutions and complex molecules, such as proteins, in which the amount of a particular proton in the molecule is small. The difference between PMR spectra and other NMR spectra is in the range of chemical displacement. The chemical displacement range for PMR is 10PPM in most cases. While for the 12C core the chemical displacement is up to about 200PPM, for the 19F and 21P spectra it is 300 and 400PPM, respectively. In NMR methods, the units used are usually time (seconds), angle (degrees or radians), temperature (Kelvin), magnetic field strength (Tesla, T), energy (joules), vibration (rpm) and power ( Watts) is. [5] Components of the NMR Device The important components of an NMR spectrometer are shown schematically in Figure (1). A brief description of each component is given below.