The corrosion mechanism taking place in an aqueous phase with or without mechanical contact is electrochemical in nature. The electrochemical signal is one of the primary sources of information that relates to behavior in potential, current, and electrical charge of a corroding electrode. It arises from processes that cause corrosion and other electrochemical reactions. In a sliding contact in an ionic electrolyte medium, electrochemistry is more likely to interfere with the tribological behavior of tribocorrosion systems. In recent years, attempts by researchers have been made to control the material loss by electrochemical methods for various engineering systems.
Most metallic corrosion occurs via electrochemical reactions at the interface between the metal and an electrolyte solution. For example, a thin film of moisture on a metal surface forms the electrolyte for atmospheric corrosion. A second example is when wet concrete is the electrolyte for reinforcing rod corrosion in bridges. Although most corrosion takes place in water, corrosion in non-aqueous systems is not unknown.
The fee of the quantitative Rietveld analysis using MAUD software depends on the XRD pattern complexity
Payment Upon Completion
 Send your patterns...
1. Introduction
Today several instruments for fast spectra recording are available. In most cases the difficulty is to process and analyze the data quickly in a reliable way. The Maud program, in one of its many undocumented features, can be used to process a list of analyses in batch mode from the console without requiring the interface. This is useful to process quickly similar spectra or launch a slow/time consuming refinement in a remote computer without recurring to the interface that would need to open a session involving the remote display setting.
Only 10$ per sample for interpreting of your UV-Vis spectrum
Payment Upon Completion
  Send your UV-Vis spectra...
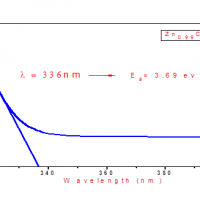
STEP1: Open the absorption graph of the material, which is obtained from the UV Vis spectroscopy.
Theory Behind Calculations: UV Vis Spectroscopy absorption peak means the Electrons are absorbing the Energy at some specific wavelength. Electrons are absorbing Energy means the Electrons are going to excited state from its ground state. Electrons are going to excited state from its ground state means the material is having band gap, thus which can be determine by absorption wavelength.
Only 10 $ per sample for interpreting of your FT-IR spectrum
Payment Upon Completion
 Send your spectra...
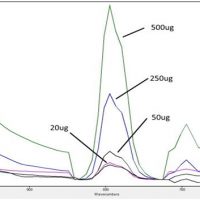
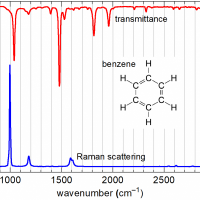
FTIR Spectroscopy is an analytical technique used to identify organic, polymeric, and, in some cases, inorganic materials. The FTIR analysis method uses infrared light to scan testsamples and observe chemical properties. When trying to identify an unknown material, FTIR (Fourier Transform Infrared Spectroscopy) analysis is a great tool to answer, “What is it?”. It works well for solids, liquids and gases, and can be applied to pure substances or mixtures. Quantitative or qualitative analysis is available. FTIR is not the best technique to measure trace contaminants, but functions extremely well identifying bulk materials.
Contact us for more information about downloading of EC-lab, Zview and ZsimpWin
Only 10$ per sample for interpreting of your EIS spectrumPayment Upon Completion
Send your EIS spectra...
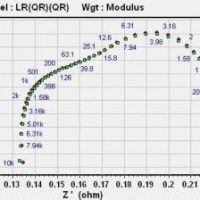
EIS Spectrum Analyser
EIS Spectrum Analyser is a standalone program for analysis and simulation of impedance spectra. The analyser routine is based on algorithms of the PDEIS spectrometer. In the original (potentiodynamic) version the impedance data analysis is applied on a 3D spectrum and gives dependences of the ac response components on electrode potential.
Check the CONTACT US page to see the interpretation fee of different analyses:
FT-IR, XRD, XPS, Raman, TGA/DTG, UV-Vis, SEM/TEM/AFM, EDS, BET, NMR, etc.Payment Upon Completion
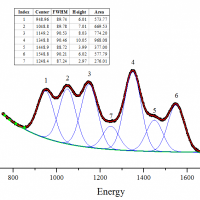
In OriginPro, the Peak Analyzer is capable of creating and subtracting baseline. There are various ways for baseline creation. You can generate baseline anchor points automatically or manually and then connect them with interpolation or fit them with a function.
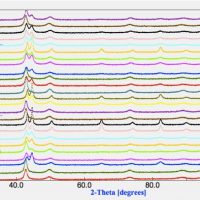
Our XRD interpretation includes:
1. Phase determination
2. Determination of diffracted planes
3- Calculation of crystalline size and microstrain
4- Whatever your request
Its cost is only 12$Payment Upon Completion
Send your patterns...
XRD is a non-destructive test method used to analyze the structure of crystalline materials. XRD analysis, by way of the study of the crystal structure, is used to identify the crystalline phases present in a material and thereby reveal The chemical composition information. JCPDS does not exist now. It has not existed since 1978. It is now known as ICDD. These particular files have never been, are not, and never will be free; it a commercial only database. There are other free databases, however. Vikas has given you a starting point.
Only 8$ for interpretation of your EDS spectrum
and 10$ per sample for interpreting of your SEM/TEM micrograghsPayment Upon Completion
Send your results...
1- DTSA-II
DTSA-II is a multi-platform software package for quantitative x-ray microanalysis. DTSA-II was inspired by the popular Desktop Spectrum Analyzer (DTSA) package developed by Chuck Fiori, Carol Swyt-Thomas, and Bob Myklebust at NIST and NIH in the ’80’s and early ’90’s.
Only 10 $ per sample for interpreting of your Raman spectrum
Payment Upon Completion

Contact us...
In this course the general introduction to Raman spectroscopy and microscopy will be provided and practical tips as well as examples will be given. The capability of Raman spectroscopy for the analysis of real-life samples (paint components, clays, coating materials, etc.) taken from historical and archaeological objects will be discussed.