BET and its application in adsorption monitoring

INTERPRETATION AND ANALYSIS OF BET RESULTS
Only 12$ per sample for interpreting of your polarization and EIS results Payment Upon Completion 
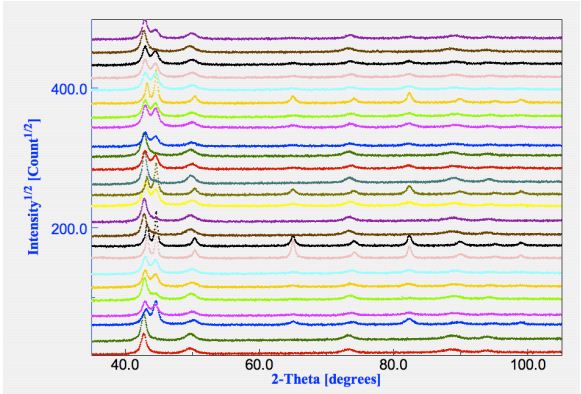
Send your BET results... Adsorption is a process where a solid or liquid substance is attracted and held onto the surface of another material. It is an essential process in many industries, including water treatment, food processing, and pharmaceuticals. The effectivene...
Read more

Quantitative Rietveld analysis in batch mode with Maud

Quantitative Rietveld analysis in batch mode with Maud
Click here to see other posts about XRD The fee of the quantitative Rietveld analysis using MAUD software depends on the XRD pattern complexity Payment Upon Completion Send your patterns... 1. Introduction Today several instruments for fast spectra recording are available. In most cases the difficultyis to process and analyze the data quickly in a reliable way. The...
Read more

Free software for EDS analysis

Click here to see other posts about EDS Only 8$ for interpretation of your EDS spectrum and 10$ per sample for interpreting of your SEM/TEM micrograghs Payment Upon Completion Send your results... 1- DTSA-II DTSA-II is a multi-platform software package for quantitative x-ray microanalysis. DTSA-II was inspired by the popular Desktop Spectrum Analyzer (DTSA) package d...
Read more

What is Raman spectroscopy?

What is Raman spectroscopy?
Click here to see other posts about Raman Only 10 $ per sample for interpreting of your Raman spectrum Payment Upon Completion Contact us... In this course the general introduction to Raman spectroscopy and microscopy will be provided and practical tips as well as examples will be given. The capability of Raman spectroscopy for the analysis of real-life samples (paint ...
Read more

How EDS works?

How EDS works?
Click here to see other posts about EDS Only 8$ per sample for interpreting of your EDS spectrum and 10$ per sample for interpreting of your SEM/TEM micrograghs Payment Upon Completion Send your results... Interaction of an electron beam with a sample target produces a variety of emissions, including x-rays. An energy-dispersive (EDS) detector is used to separate ...
Read more

Fundamentals of Energy-dispersive X-ray spectroscopy (EDS)

Fundamentals of Energy-dispersive X-ray spectroscopy (EDS)
Click here to see other posts about EDS Only 8$ per sample for interpreting of your EDS spectrum and 10$ per sample for interpreting of your SEM/TEM micrograghs Payment Upon Completion Send your results... X-ray is a kind of electromagnetic wave, the same as light. The wavelength of visible light is 400 to 800nm, while the wavelength of x-ray is much shorter (higher en...
Read more

Interpretation steps of a NMR spectrum

Interpretation steps of a NMR spectrum
Click here to see more posts about NMR Only 15$ per sample for interpreting of your NMR spectrum Payment Upon Completion Send your results... Nuclear Magnetic Resonance (NMR) spectroscopy is an incredibly powerful tool for characterizing molecular structures. When submitting to the FDA or other regulatory agencies, full structural characterization by NMR provides crucial...
Read more

Fundamentals of Nuclear Magnetic Resonance Spectroscopy

Fundamentals of Nuclear Magnetic Resonance Spectroscopy
Click here to see more posts about NMR Only 15$ per sample for interpreting of your NMR spectrum Payment Upon Completion Send your results... Over the past fifty years nuclear magnetic resonance spectroscopy, commonly referred to as nmr, has become the preeminent technique for determining the structure of organic compounds. Of all the spectroscopic methods, it is the onl...
Read more

A to Z of Atomic force microscopy (AFM)

A to Z of Atomic force microscopy (AFM)
Click here to see other posts about AFM Only 10 $ per sample for interpreting of your SEM/TEM/AFM micrograph Payment Upon Completion Send your micrographs... Atomic force microscopy (AFM) is a technique with multiple applications in biology. This method is a member of the broad family of scanning probe microscopy and was initially developed in 1986 by Binnig et al to o...
Read more

Vibrating Sample Magnetometry (VSM), A review

Vibrating Sample Magnetometry (VSM), A review
Click here to see more posts about VSM Only 10$ for interpretation of your VSM curve Payment Upon Completion Send your VSM curves... Vibrating Sample Magnetometry (VSM) is a measurement technique which allows todetermine the magnetic moment of a sample with very high precision. The aim of thislab course M106 is to enlarge upon the use of this widespread technique intro...
Read more