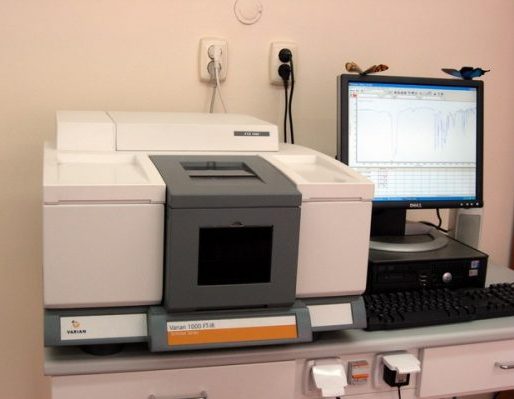
Only 10 $ per sample for interpreting of your FT-IR, Raman, XRD, UV-Vis, and XPS spectrum Payment Upon Completion Send your spectra...
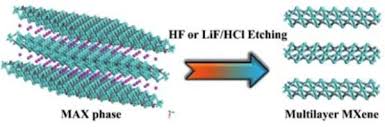
What is Mxene?
Mxene is a class of two-dimensional (2D) transition metal carbides, nitrides, and carbonitrides that exhibit unique properties such as high electrical conductivity, excellent mechanical strength, and high surface areas. M...
Read more