What are differences between EIS and polarization methods for corrosion monitoring?

How to analyze polarization curves?
Corrosion is a major concern in many industries, as it can cause significant damage to infrastructure and equipment. To prevent corrosion, it is important to monitor the corrosion rate and take appropriate measures to mitigate it. (more…)
Read more

BET and its application in adsorption monitoring

INTERPRETATION AND ANALYSIS OF BET RESULTS
Only 12$ per sample for interpreting of your polarization and EIS results Payment Upon Completion Send your BET results... Adsorption is a process where a solid or liquid substance is attracted and held onto the surface of another material. It is an essential process in many industries, including water treatment, food processing, and pharmaceuticals. The effectivene...
Read more

Differences between FTIR and Raman spectroscopy

Only 10 $ per sample for interpreting of your FT-IR spectrumPayment Upon Completion Send your spectra... Raman and Fourier Transform Infrared (FTIR) spectroscopy are two of the most widely used analytical techniques in the field of chemistry. Both techniques are used to identify the chemical composition of a sample, but they differ in their mechanisms of analysis and the ty...
Read more

Raman Spectroscopic Study of Graphene

Raman Spectroscopic Study of Graphene
Click here to see other posts about Raman Only 10 $ per sample for interpreting of your Raman spectrum Payment Upon Completion Contact us... We present here results on a Raman spectroscopic study of the deposited defected graphene on Si substrates by chemical vapor deposition (thermal decomposition of acetone). The graphene films are not deposited on the (001) Si subst...
Read more

Corrosion monitoring using EIS and polarization techniques

Corrosion monitoring using EIS and polarization techniques
See more posts about EIS and polarization tests Only 10$ per sample for interpreting of your polarization and EIS results Payment Upon Completion Send your polarization/EIS results... The corrosion mechanism taking place in an aqueous phase with or without mechanical contact is electrochemical in nature. The electrochemical signal is one of the primary sources of info...
Read more

How to analyze polarization curves?

How to analyze polarization curves?
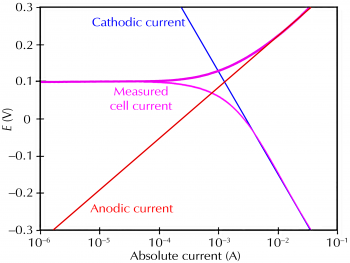
See more posts about the polarization test Only 10$ per sample for interpreting of your polarization curve Payment Upon Completion Send your polarization results... Most metallic corrosion occurs via electrochemical reactions at the interface between the metal and an electrolyte solution. For example, a thin film of moisture on a metal surface forms the electrolyte fo...
Read more

Free software for fitting EIS spectra

Free software for fitting EIS spectra
Contact us for more information about downloading of EC-lab, Zview and ZsimpWin Only 10$ per sample for interpreting of your EIS spectrum Payment Upon Completion Send your EIS spectra... EIS Spectrum Analyser EIS Spectrum Analyser is a standalone program for analysis and simulation of impedance spectra. The analyser routine is based on algorithms of the PD...
Read more

What are the main differences between an SEM, an ESEM, an SEM-FIB and an (S)TEM?

What are the main differences between an SEM, an ESEM, an SEM-FIB and an (S)TEM?
Click here to see other posts about SEM Only 10 $ per sample for interpreting of your SEM/TEM/AFM micrograph Payment Upon Completion Send your micrographs... The Scanning Electron Microscope (SEM) produces images by probing the specimen with a focused electron beam that is scanned across a rectangular area of the specimen (raster scanning). (more…)
Read more

How to analyze TGA thermograms

How to analyze TGA thermograms
Click here to see other posts about TGA/DTG Only 8$ per sample for interpreting of your TGA thermogram Payment Upon Completion Send your thermograms... In thermogravimetric analysis (TGA), a sample is continually weighted while heating, as an inert gas atmosphere is passed over it. Many solids undergo reactions that evolve gaseous byproducts. In TGA, these gaseous bypr...
Read more

A to Z of Atomic force microscopy (AFM)

A to Z of Atomic force microscopy (AFM)
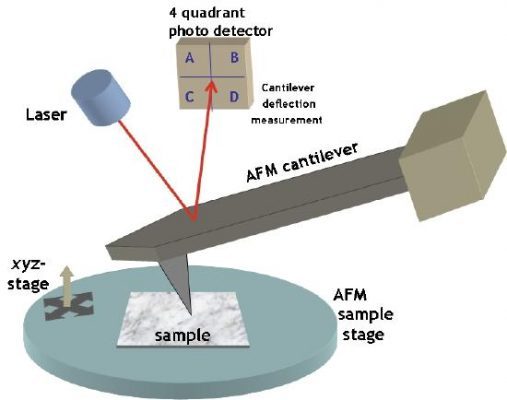
Click here to see other posts about AFM Only 10 $ per sample for interpreting of your SEM/TEM/AFM micrograph Payment Upon Completion Send your micrographs... Atomic force microscopy (AFM) is a technique with multiple applications in biology. This method is a member of the broad family of scanning probe microscopy and was initially developed in 1986 by Binnig et al to o...
Read more