Quantitative Rietveld analysis in batch mode with Maud

Quantitative Rietveld analysis in batch mode with Maud
Click here to see other posts about XRD The fee of the quantitative Rietveld analysis using MAUD software depends on the XRD pattern complexity Payment Upon Completion Send your patterns... 1. Introduction Today several instruments for fast spectra recording are available. In most cases the difficultyis to process and analyze the data quickly in a reliable way. The...
Read more
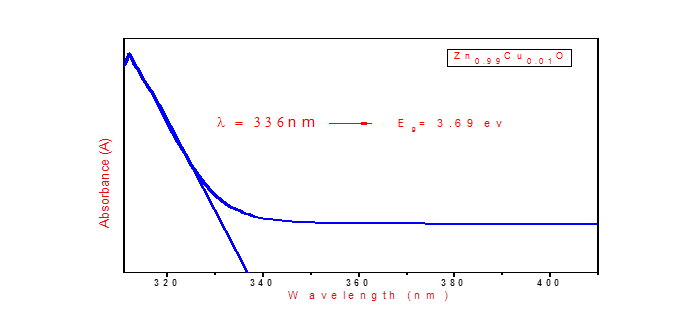
Determination of band gap using UV-Vis spectra

Determination of band gap using UV-Vis spectra
Click here to see more posts about UV-Vis spectroscopy Only 10$ per sample for interpreting of your UV-Vis spectrum Payment Upon Completion Send your UV-Vis spectra... STEP1: Open the absorption graph of the material, which is obtained from the UV Vis spectroscopy. Theory Behind Calculations: UV Vis Spectroscopy absorption peak means the Electrons are abs...
Read more

Quantification of FT-IR spectrum

Quantification of FT-IR spectrum
Click here to see other posts about FT-IR Only 10 $ per sample for interpreting of your FT-IR spectrum Payment Upon Completion Send your spectra... FTIR Spectroscopy is an analytical technique used to identify organic, polymeric, and, in some cases, inorganic materials. The FTIR analysis method uses infrared light to scan testsamples and observe...
Read more

Free software for fitting EIS spectra

Free software for fitting EIS spectra
Contact us for more information about downloading of EC-lab, Zview and ZsimpWin Only 10$ per sample for interpreting of your EIS spectrum Payment Upon Completion Send your EIS spectra... EIS Spectrum Analyser EIS Spectrum Analyser is a standalone program for analysis and simulation of impedance spectra. The analyser routine is based on algorithms of the PD...
Read more

Free reference card files for interpretation of XRD patterns using software

How to analyze “XRD” patterns?
Click here to see other posts about XRD Our XRD interpretation includes: 1. Phase determination 2. Determination of diffracted planes 3- Calculation of crystalline size and microstrain 4- Whatever your request Its cost is only 12$ Payment Upon Completion Send your patterns... XRD is a non-destructive test method used to analyze the structure of cryst...
Read more

Free software for EDS analysis

Click here to see other posts about EDS Only 8$ for interpretation of your EDS spectrum and 10$ per sample for interpreting of your SEM/TEM micrograghs Payment Upon Completion Send your results... 1- DTSA-II DTSA-II is a multi-platform software package for quantitative x-ray microanalysis. DTSA-II was inspired by the popular Desktop Spectrum Analyzer (DTSA) package d...
Read more

What is Raman spectroscopy?

What is Raman spectroscopy?
Click here to see other posts about Raman Only 10 $ per sample for interpreting of your Raman spectrum Payment Upon Completion Contact us... In this course the general introduction to Raman spectroscopy and microscopy will be provided and practical tips as well as examples will be given. The capability of Raman spectroscopy for the analysis of real-life samples (paint ...
Read more

How EDS works?

How EDS works?
Click here to see other posts about EDS Only 8$ per sample for interpreting of your EDS spectrum and 10$ per sample for interpreting of your SEM/TEM micrograghs Payment Upon Completion Send your results... Interaction of an electron beam with a sample target produces a variety of emissions, including x-rays. An energy-dispersive (EDS) detector is used to separate ...
Read more

Fundamentals of Energy-dispersive X-ray spectroscopy (EDS)

Fundamentals of Energy-dispersive X-ray spectroscopy (EDS)
Click here to see other posts about EDS Only 8$ per sample for interpreting of your EDS spectrum and 10$ per sample for interpreting of your SEM/TEM micrograghs Payment Upon Completion Send your results... X-ray is a kind of electromagnetic wave, the same as light. The wavelength of visible light is 400 to 800nm, while the wavelength of x-ray is much shorter (higher en...
Read more

What are the main differences between an SEM, an ESEM, an SEM-FIB and an (S)TEM?

What are the main differences between an SEM, an ESEM, an SEM-FIB and an (S)TEM?
Click here to see other posts about SEM Only 10 $ per sample for interpreting of your SEM/TEM/AFM micrograph Payment Upon Completion Send your micrographs... The Scanning Electron Microscope (SEM) produces images by probing the specimen with a focused electron beam that is scanned across a rectangular area of the specimen (raster scanning). (more…)
Read more